Motors that run continuously while not loaded and/or needed increase energy costs. Finding ways to control these systems more effectively can lead to decreases in annual energy use. Installing programmable logic controls (PLC) and soft starts, eliminating unneeded processes, or evaluating poor worker habits are all great methods to reduce time motors unnecessarily idle.
There are many reasons idling motors are not turned off when they should be. However, the three primary reasons are because the equipment is overlooked or “forgotten”, equipment is left on when the facility is not in operation hours (i.e. nights and/or weekends), or because of poor workplace habits or processes. Overlooked equipment is typically machinery that is no longer needed but left on or when cost savings have never been properly evaluated. Similarly, equipment is regularly left on during off hours due to a lack of awareness of how much energy is being used unnecessarily. Lastly, there are often poor process habits that can significantly increase energy consumption. An example of this may be a worker not turning off a motor during breaks, shift change, lunch, etc.
☑ Live Readings: Using a power quality analyzer (PQA), obtain a live reading of the motor output power in kW.
☑ Nameplate Readings: Note the hp of the motor in question and all other pertinent information.
☑ Datalogger Readings: It is a best practice to datalog the motor to obtain a more proficient idea of current motor use.
Scenario 1: Only Nameplate Readings Available - This can be the case if the electric panel is inaccessible or if the voltage is too high to safely retrieve live readings, for example.
Start by downloading the Motor Analysis Tool (MAT) from Google Drive --> 0 OSU EEC Template Directory --> 0 - Best Templates --> Motor Analysis Tool (MAT) --> mat.analysis tool.xlsx
From here you should be able to open excel file and see a blank document.
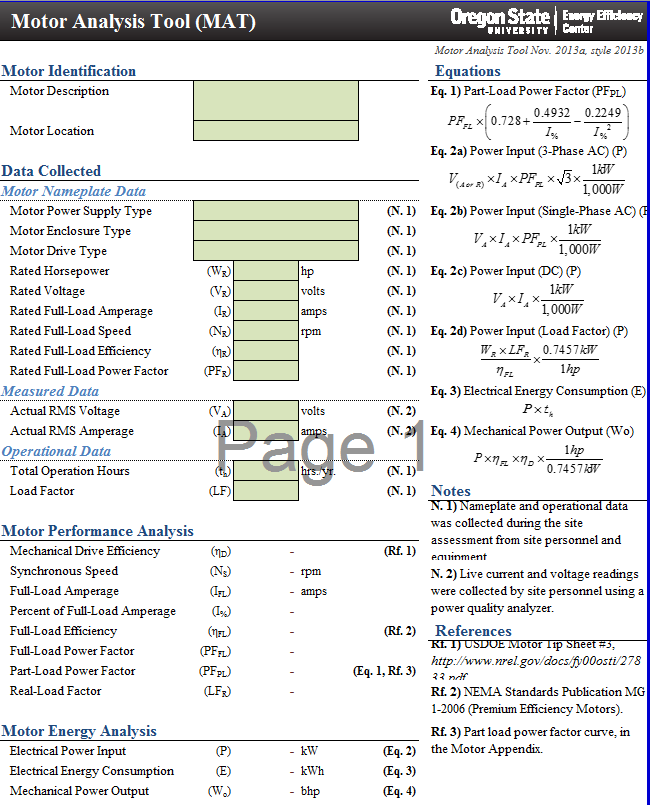
Figure 1: Unpopulated MAT excel spreadsheet
Using nameplate data, populate MAT with appropriate information.
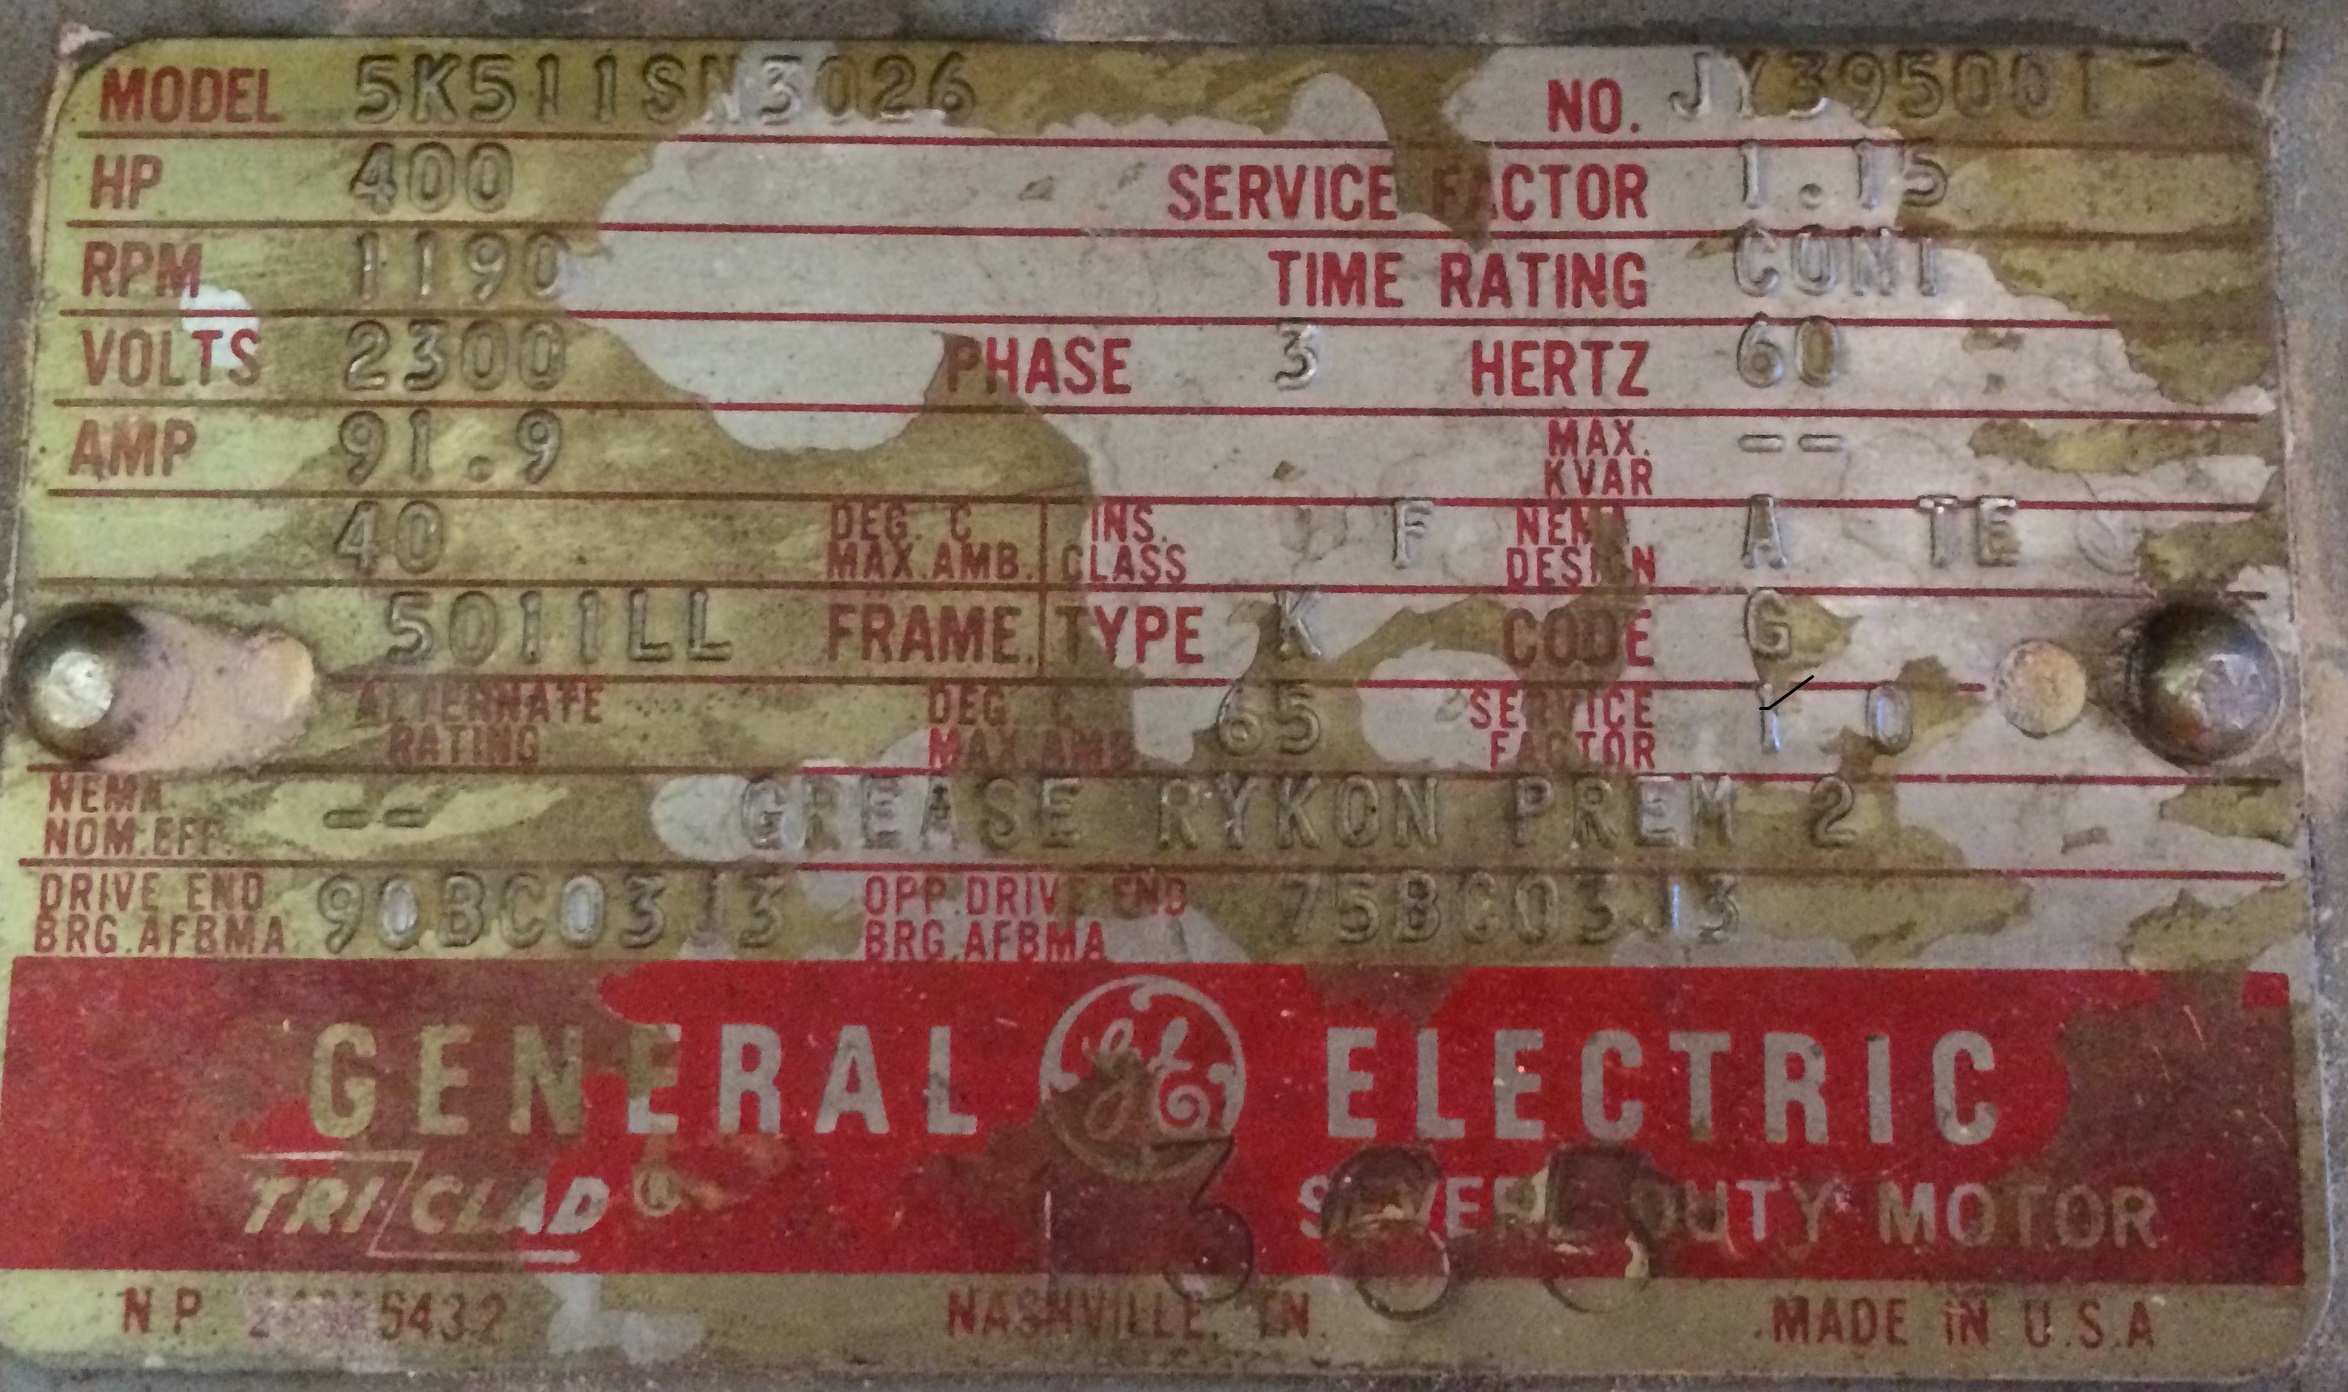
Figure 2: Example motor nameplate
In this example, the voltage is at 2300 V, which is much too high to be able to typically get live or datalog readings. However, we can still fill enough of the MAT to get an approximation of motor energy use.
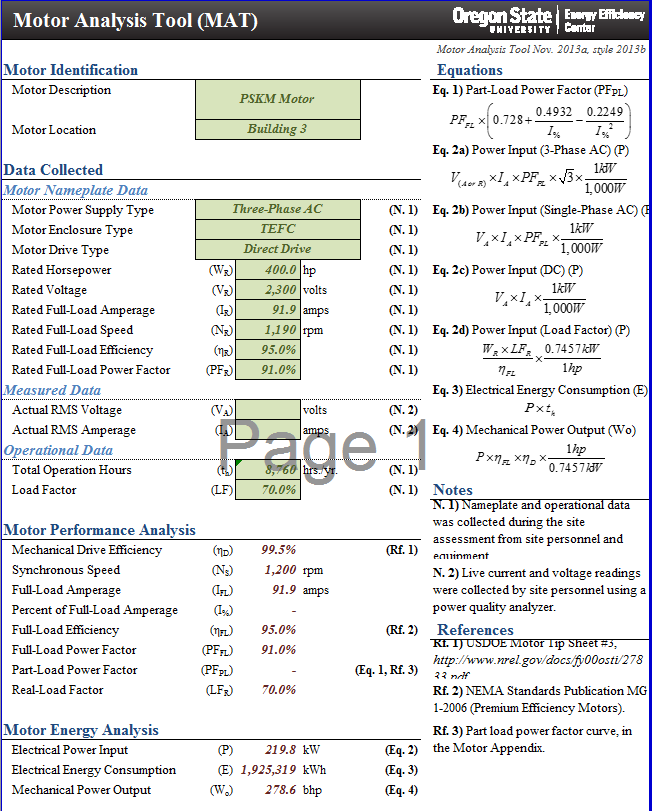
Figure 3: MAT populated using only information found on the nameplate and observed by motor appearance.
You may notice that the Motor Enclosure Type and Motor Drive Type are not listed on the nameplate. This information is often neglected on the nameplate because that information can be easily determined by motor examination. Additionally, Rated Full-Load Efficiency and Rated Full-Load Power Factor are also not listed on the nameplate. When this is the case, values may be estimated using the "Efficiency" and "Power Factor" tabs located in the MAT. Using the rpm and hp of the motor, both values can be found. Sometimes linear interpolation may be needed if specific rpm and/or hp is not specifically listed.
This leaves us with the two measured data boxes unfilled. Since this information is unavailable, the MAT will calculate Electric Energy Consumption (EEC) without Actual RMS Voltage or Amperage.
With a calculated EEC, savings can now be developed by estimating by multiplying the EEC times percentage motor can be shut down.
Start by downloading the Motor Analysis Tool for Datalog (MAT) from Google Drive --> 0 OSU EEC Template Directory --> 0 - Best Templates --> Motor Analysis Tool (MAT) --> mat_datalog.analysis_tool.xlsx
After successfully uploading the datalogger amperage files, begin by going to the "Data Log Analysis" tab in the MAT.
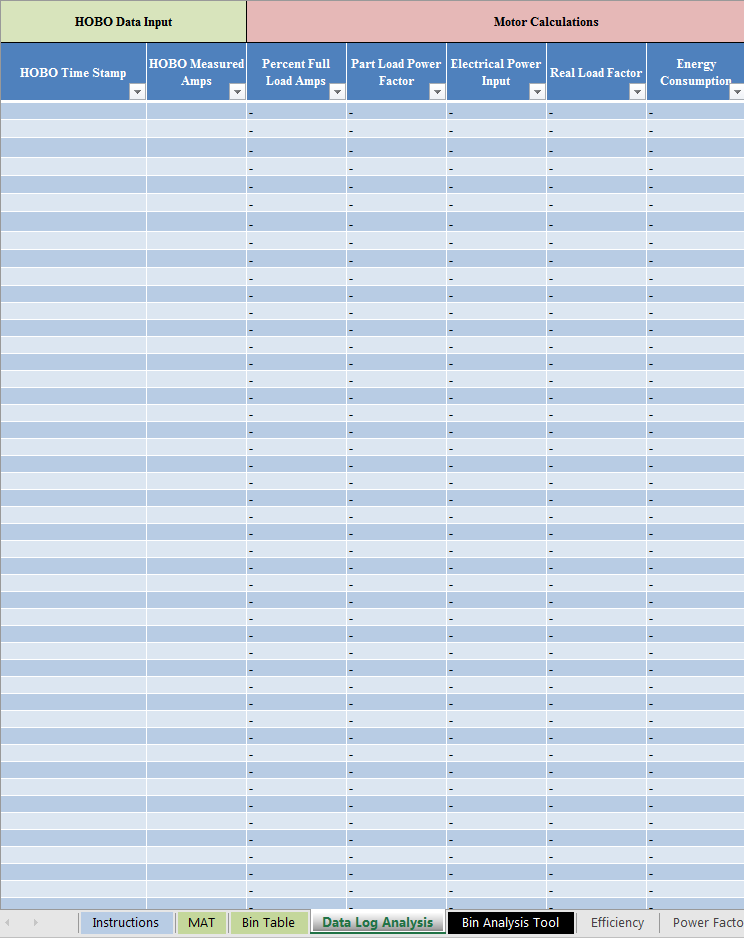
Figure 4: Unpopulated Data Log Analysis Sheet
Copy-and-Paste appropriate values into the HOBO Time Stamp and HOBO Measured Amps columns. After correctly doing so, the Motor Calculations should auto-populate.
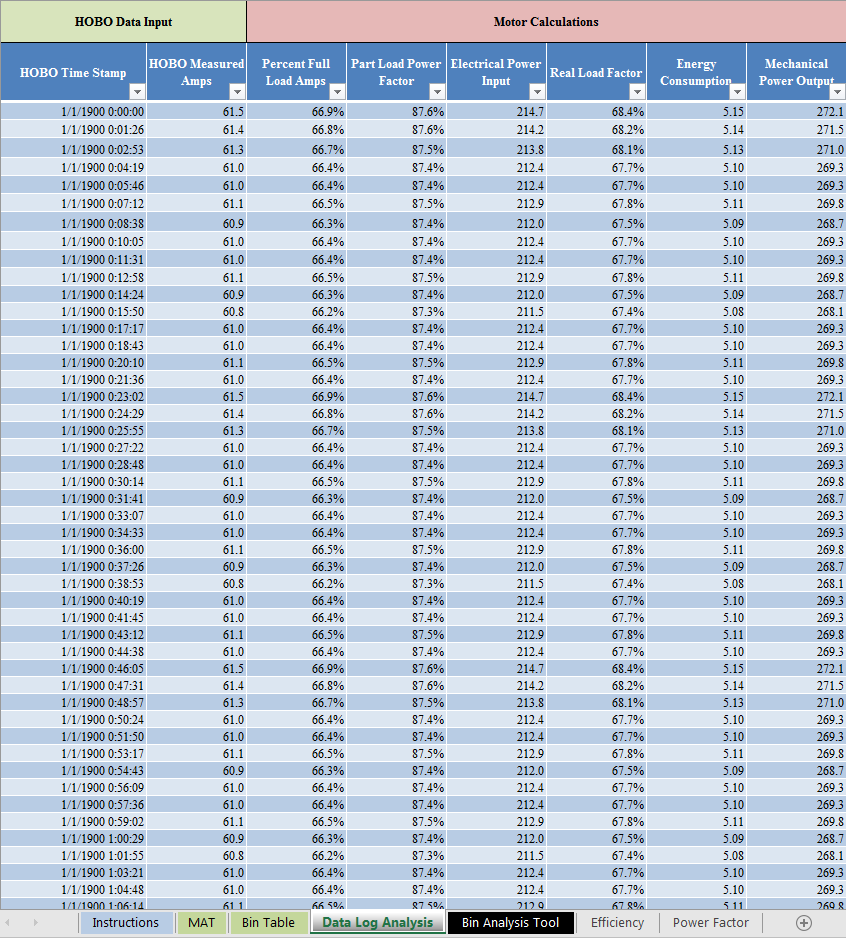
Figure 5: Data Log Analysis tab after being auto-populated
Once auto-populated, go to the MAT tab and fill in information. In the below example, we will use the nameplate information found in Figure 2. For live information, follow the "Motor Live Power Readings" module found in this course and fill in MAT accordingly. In this example, a live reading of 2,300.0 Volts was found. Please note that this high of voltage is normally not in the realm of possible live readings we could obtain.
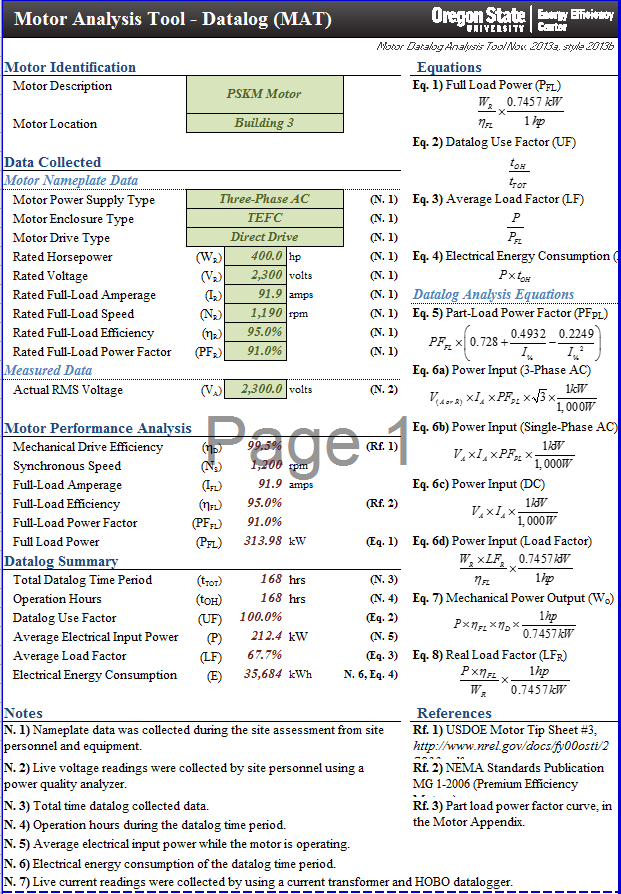
Figure 6: Datalog MAT after importing Data Log Analysis and filling in nameplate data in MAT tab.
From here, EEC can be found and calculated similarly to Scenario 1. It should be noted that this value ONLY represents the amount of energy consumed during the datalog period (typically 7 days).
Start by downloading the Motor Analysis Tool (MAT) from Google Drive --> 0 OSU EEC Template Directory --> 0 - Best Templates --> Motor Analysis Tool (MAT) --> mat.analysis tool.xlsx
This scenario is very similar to scenario 1 except now the measured data inputs can now be populated. The MAT will use different equations to calculate the EEC, but the steps needed to find savings will be identical.