Downsizing motors will improve power factor and reduce power factor penalty charges by the electric utility, as well as reduce the kVARs of additional capacitance. The graph below shows how the efficiency plummets for motors at light loads.
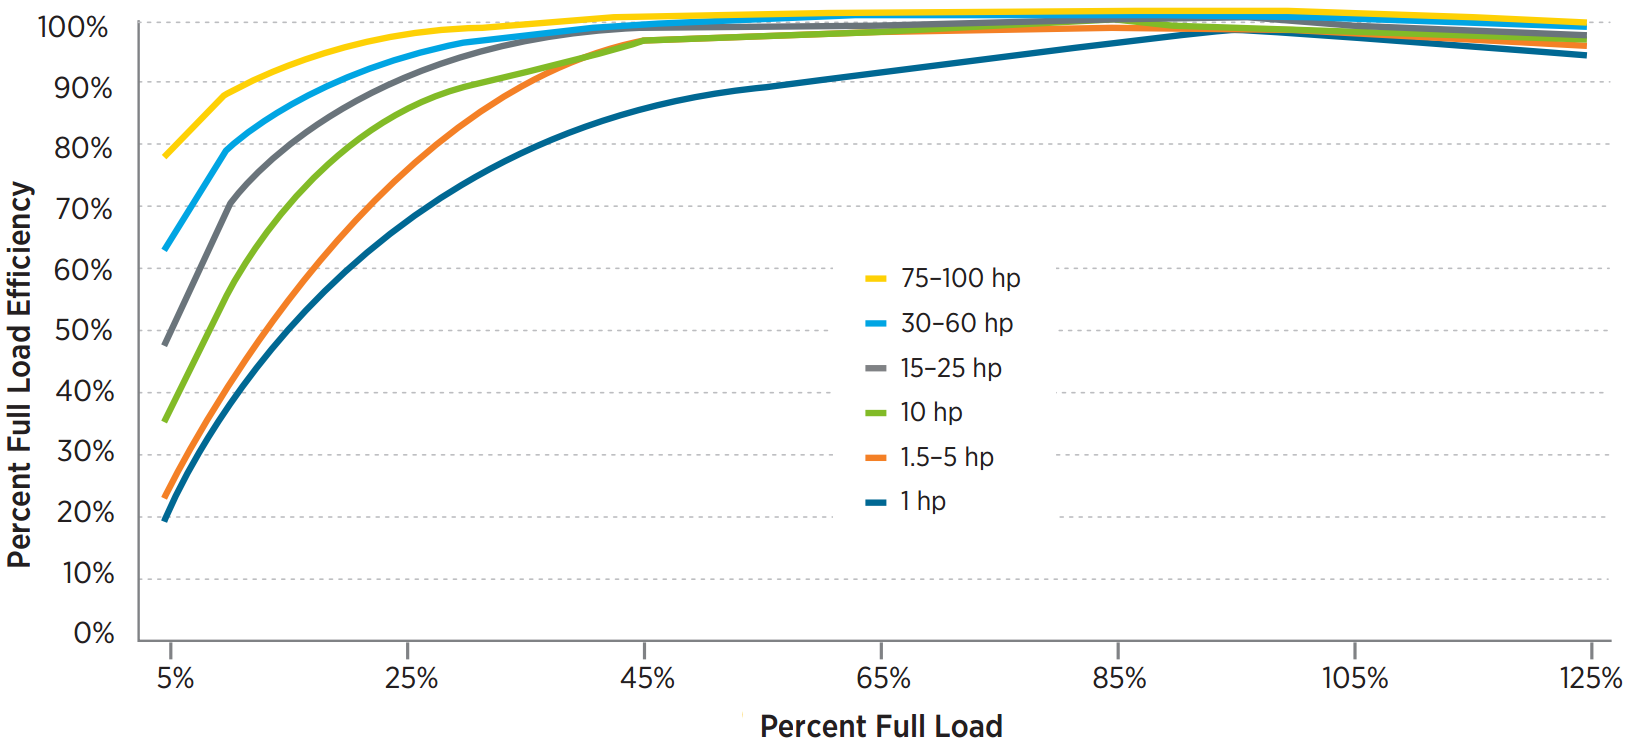
Figure 1: Motor Efficiency vs Percent Load
Any motor that operates continuously at part load is a candidate. Examples of motors you may encounter which are often good candidates include chippers and hogs. Verify that it will not be loaded beyond its capacity at some point in its operation.
Information Needed for Recommendation
☑ Live Readings: Using a power quality analyzer (PQA), obtain a live reading of the motor output power in kW. Have plant personal load motor as much as possible to simulate worst case scenario as we do not want to recommend a motor too small. An example of this may be to have plant personnel feed through as much material as possible through a chipper while recording live readings.
☑ Nameplate Readings: Note the hp of the motor in question and all other pertinent information.
☑ Datalogger Readings: It is a best practice to datalog the motor to obtain a more proficient idea of the maximum motor load.
Saving Estimation Calculate % Motor Load.
Below is a method to develop a quick SWAG you can perform to get a rough idea of potential savings available.
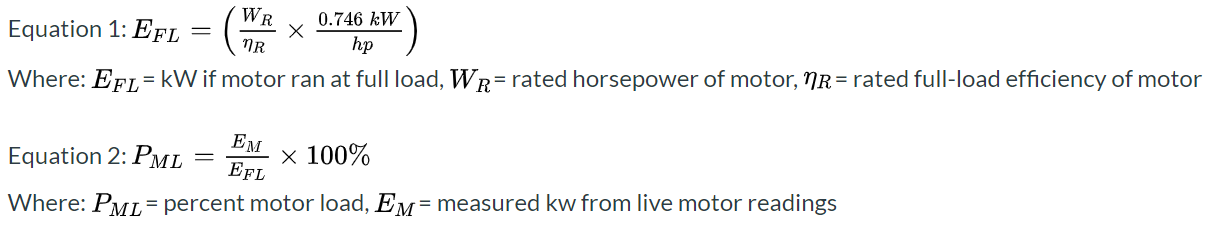
With % motor load solved for, you can use Figure 1 above to find the approximate efficiency the motor is currently being operated at. If the % motor load is above 50%, there is likely little room for motor efficiency improvements. If it is below 50%, an approximation of savings can be found by comparing current full load efficiency with efficiency if motor was sized appropriately (generally ~96-98%).
If potential savings are great enough to develop into an AR, the first step would be to complete a MAT. Below is an example of a completed MAT with an example nameplate.
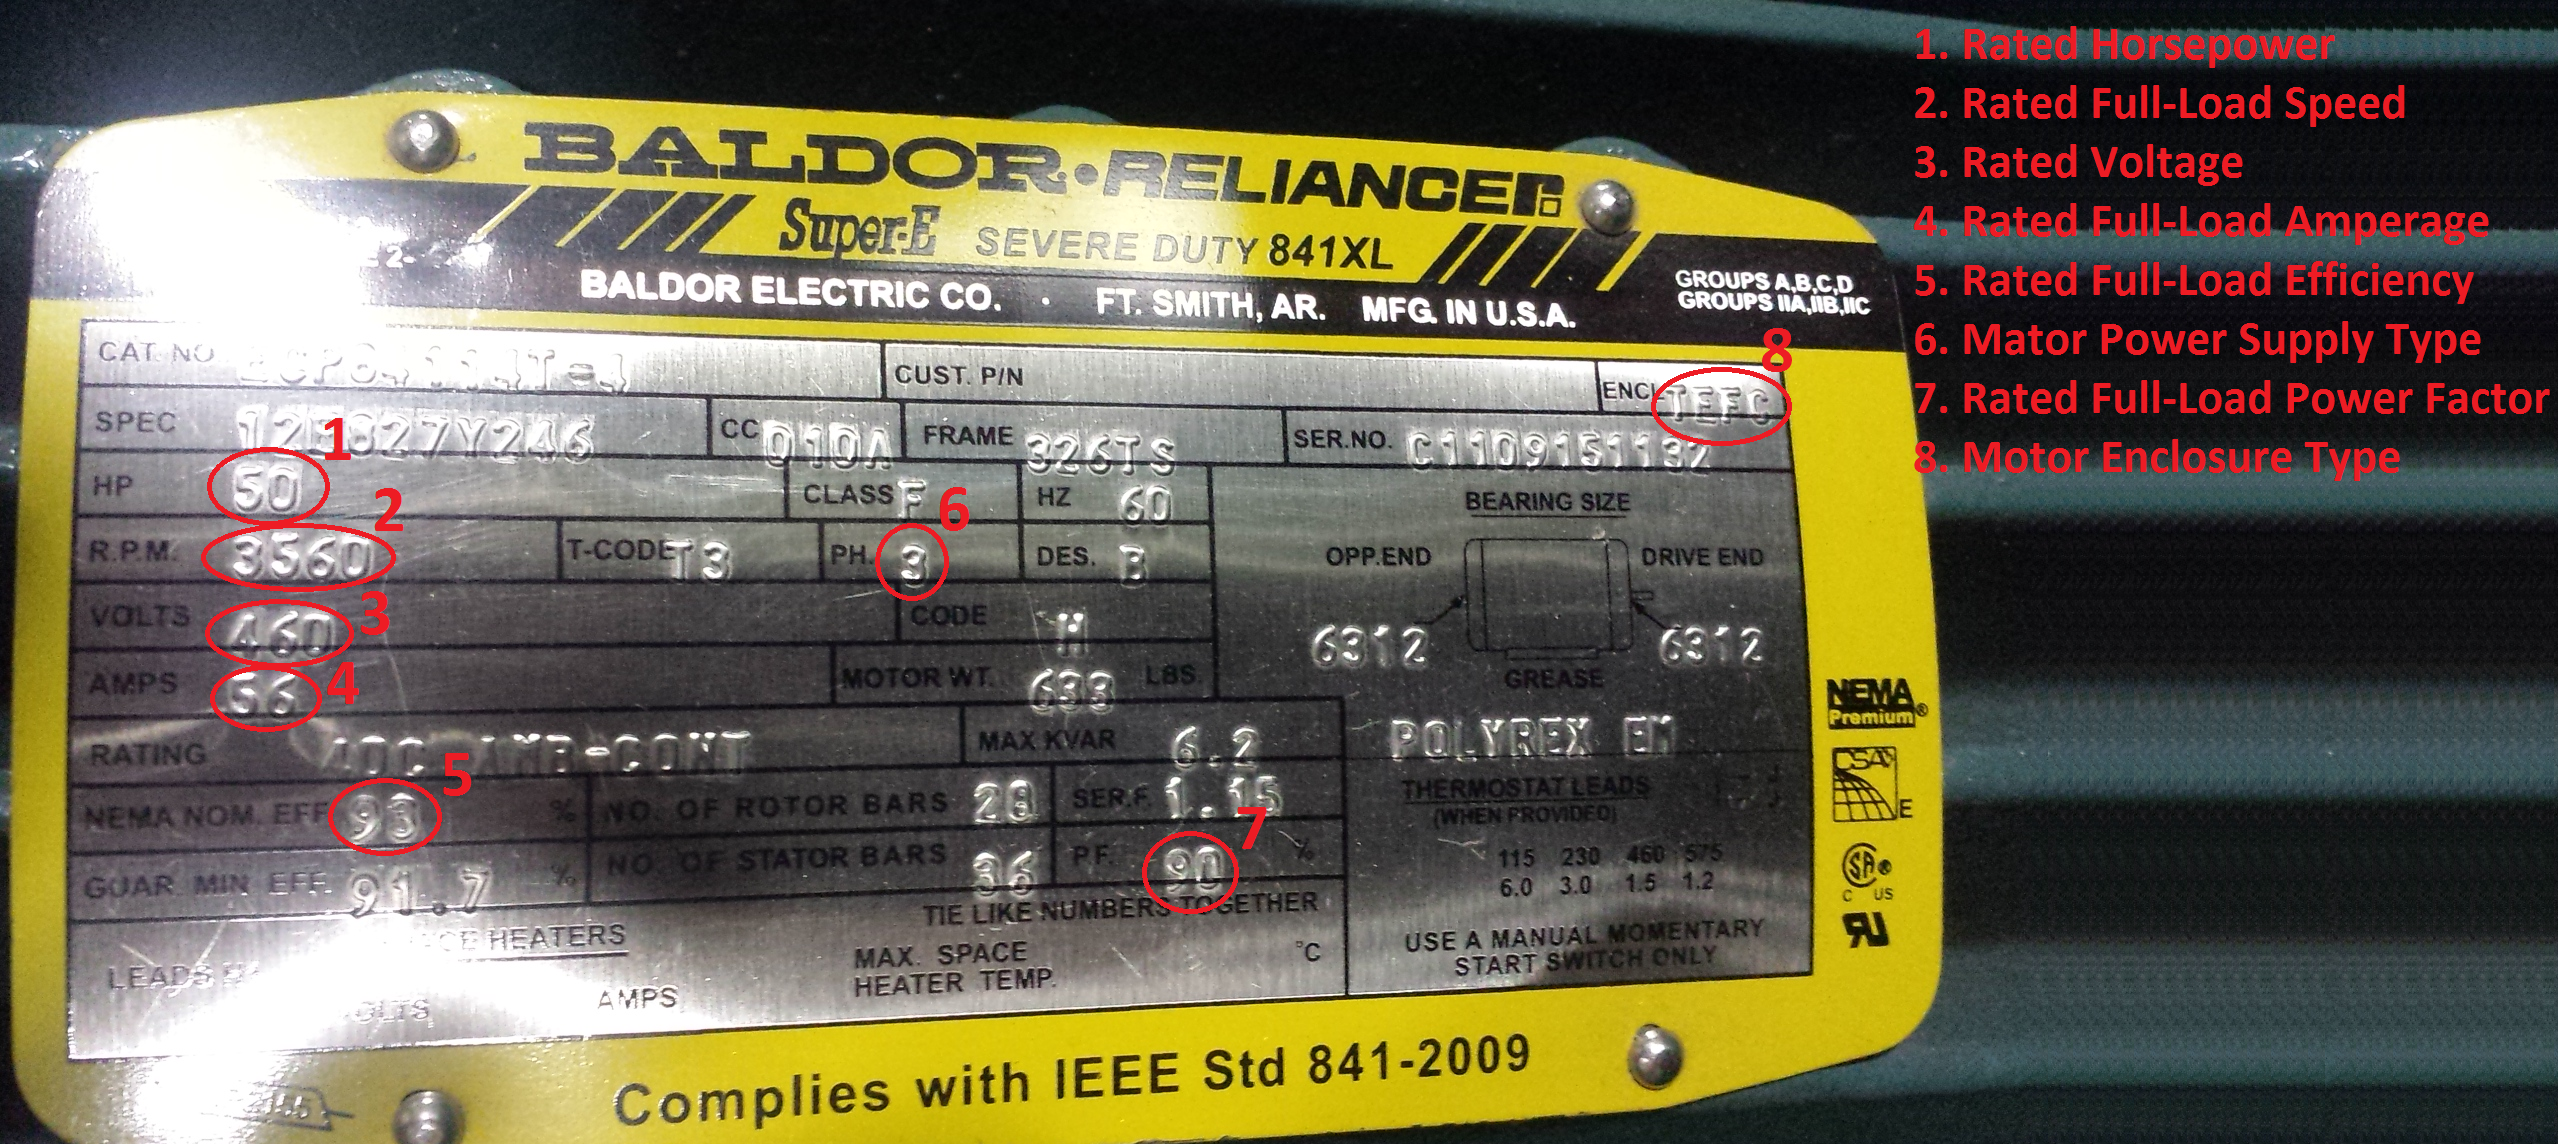
Figure 2: Example motor nameplate
Often, the motor enclosure type and motor drive type will not be listed on the motor nameplate. These can be determined by visual inspection, however.
From here, enter in live readings in the measured data section of the MAT and copy and paste datalogger values in the "Data Log Analysis" tab on the MAT, if applicable. Once finished, the tool should look similar to the below image.
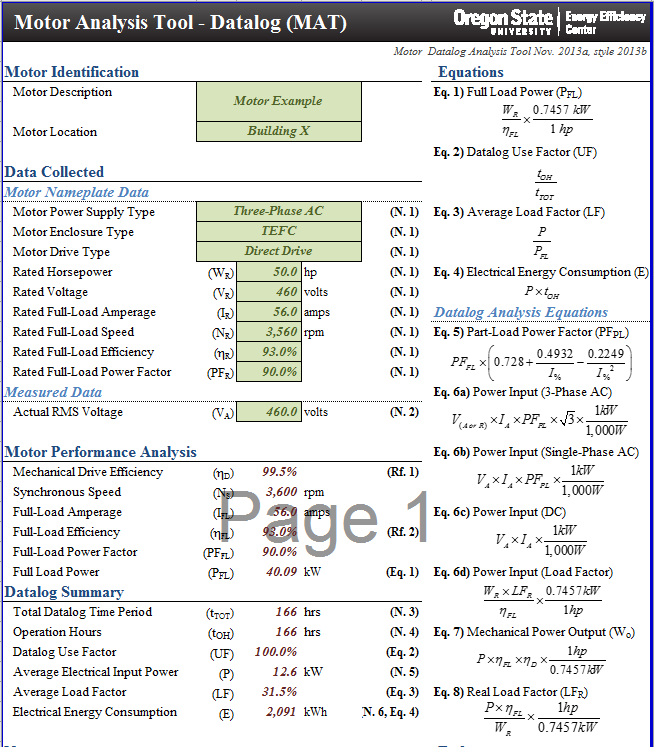
Figure 3: MAT filled out using live reading, data log data, and nameplate information shown in Figure 2
From here, the electric energy consumption (E) will be calculated. It should be noted, this energy figure only represents the energy consumed during the duration that the datalogger collected data. This means annual energy consumption will need to be adjusted accordingly. In this case, E would need to be multiplied by 52.77 (8,760 hrs/yr divided by 166 hrs) to model annual electrical energy consumption by motor.
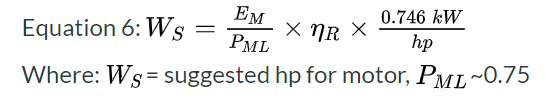
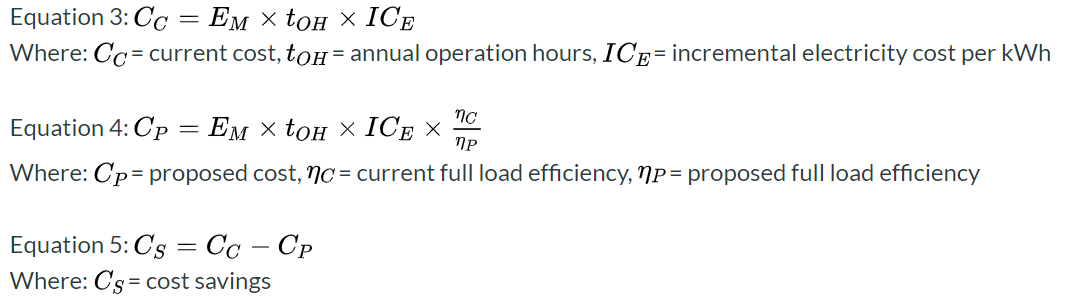
Now that a model which calculates current annual electrical energy consumption has been developed, savings can be calculated. This can be approximated using Figure 1 and can be seen being calculated in Equation 4. The recommended hp can be calculated by rearranging Equations 1 and 2 and solving for hp using a % motor load which has an optimal full load efficiency (~75%).